
Supplier Switch
Solar Panel Payback Calculator
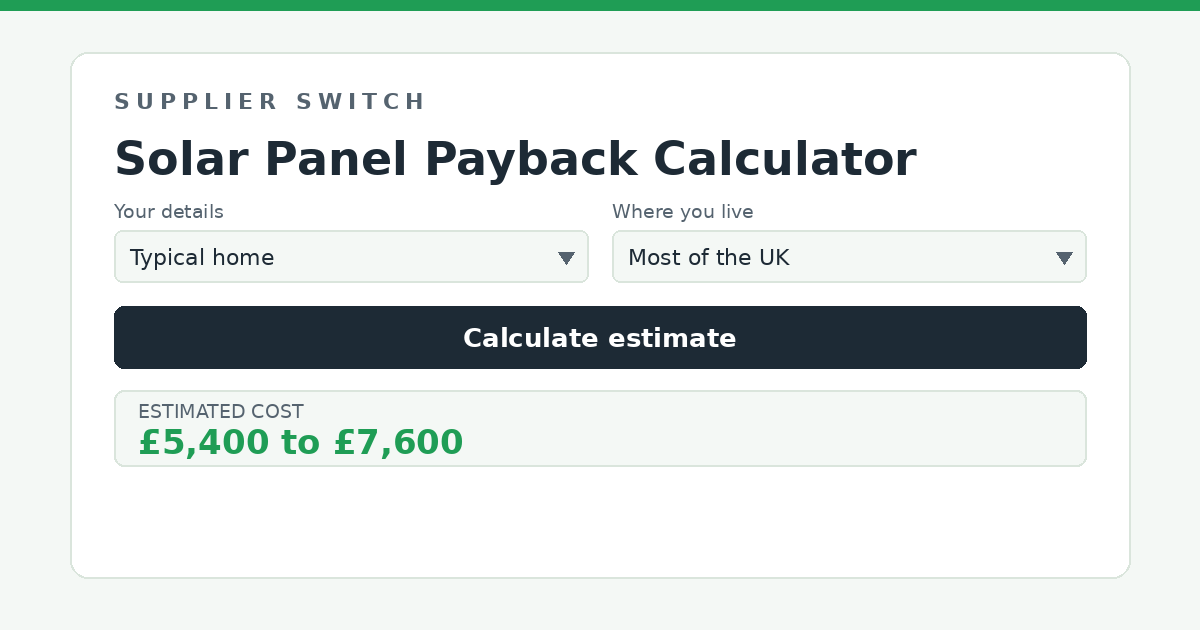
Estimate how many years a solar panel system takes to pay for itself, by combining a 2026 installed cost estimate with a realistic annual savings estimate for your situation.
Estimated installed cost
Estimated annual savings
Estimated simple payback
The low figure pairs a keen installation price with strong savings; the high figure pairs an expensive quote with cautious savings. Most households land in the middle of this band.
All figures are indicative ranges based on published UK guides and scheme documentation. Real quotes, generation and savings vary – see the explainer and disclaimer below.
How this calculator works
This calculator works in ranges rather than single figures, because real quotes, yields and tariffs genuinely vary that much. It starts from typical UK price, output and savings ranges drawn from published 2026 industry guides and official scheme documentation, then scales them by the quantities you enter and adjusts them for each choice you make below. The result is a low-to-high band that a realistic outcome is likely to fall within, not a promise of the figure you will achieve.
Published 2026 analyses put typical UK solar payback at roughly 8 to 11 years for a well specified system without a battery, after which the panels generate essentially free electricity for the remainder of their 25 to 30 year life. A representative worked example, a 4 kWp system at in the Midlands saving around a year, pays back in about 10 years and returns a net profit of roughly over 25 years.
System size
Solar systems are sized in kilowatts peak (kWp), the output of the panels under standard test conditions. A 4 kWp system of around 10 modern panels is the most common choice for a UK three bedroom home, while larger households, or homes with an electric vehicle or heat pump, often go to 6 kWp or more. Bigger systems cost less per kWp because fixed costs such as scaffolding, the inverter and installer overheads are spread across more panels, and the calculator reflects that economy of scale.
Equipment tier
Equipment tier moves the cost side of the payback sum. Premium hardware costs around 20 percent more but degrades more slowly and carries longer warranties, which matters over a 25 year horizon even though it lengthens the headline payback slightly.
Usage pattern
Self-consumption drives the savings side of the sum: power you use yourself displaces grid electricity at roughly 25 to 26 pence per kWh, while exports earn far less on most SEG tariffs. Being home during the day, shifting appliance use to sunny hours, or adding a battery all raise the annual savings and shorten payback, though a battery also adds its own cost, which this calculator does not include.
Region (solar resource)
The same panels generate more in Cornwall than in Caithness. The industry baseline is around 850 kWh per year for every kWp installed on an unshaded south-facing roof in an average UK location, with southern England running around 5 percent above that and Scotland 10 to 15 percent below. The calculator scales its output and savings figures accordingly.
What else affects the figures
Payback shortens when electricity prices rise, when self-consumption is high, and when the installation price is competitive, which is why three quotes matter as much as any technical choice. It lengthens with shading, east-west roofs, poor export rates and over-specified systems that export most of their output. Be wary of installer projections that assume steep electricity price inflation to flatter the numbers; modelling at current prices gives a conservative, honest picture, with any future price rises then working in your favour. This calculator shows simple payback and does not model panel degradation of around 0.3 to 0.5 percent a year, inverter replacement or financing costs.
Certification, planning and grid connection
Most home solar installations fall under permitted development and need no planning permission, provided panels do not protrude more than 200 millimetres from the roof plane, though listed buildings and flats have tighter rules and conservation areas restrict panels on walls fronting the highway, so check with your local planning authority if any apply. Use an MCS-certified installer: certification is required to register for Smart Export Guarantee payments and is the industry marker of a compliant installation. Your installer must also notify or seek approval from the district network operator, automatically for systems up to 3.68 kW per phase under G98 and by prior application under G99 above that. Residential solar and battery installations carry 0 percent VAT until 31 March 2027, after which the rate is due to revert to 5 percent.
Sources
The typical prices, yields and scheme details used by this calculator draw on the following published resources, which are good starting points for further research: